1. Fundamental Concepts
- Definition: A Venn diagram is a graphical representation used to show all possible logical relations between different sets.
- Components: Circles or other shapes represent sets, and their intersections represent the common elements of those sets.
- Purpose: To visualize relationships such as union, intersection, and complement of sets.
2. Key Concepts
Standard Regions:
a) : All areas covered by A or B (both circles combined).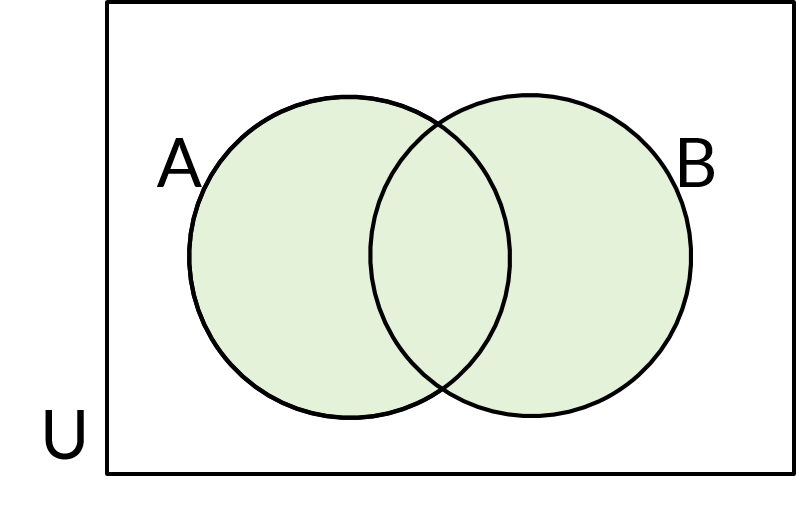
b) : Only the overlapping region.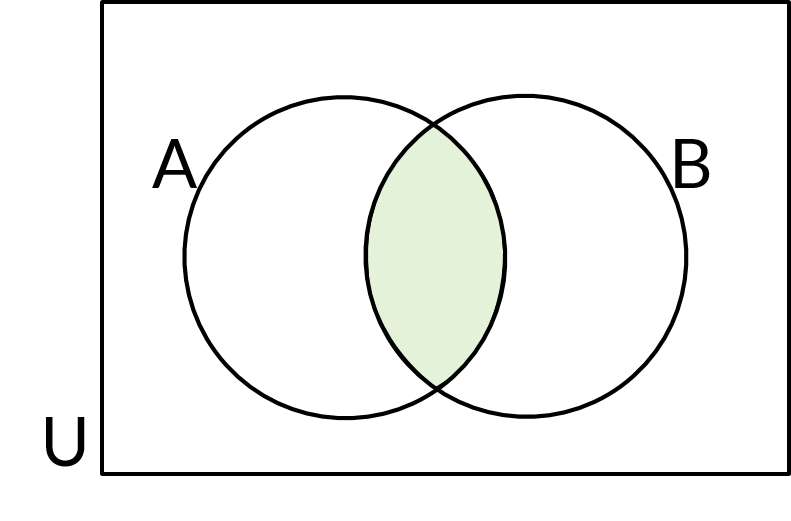
c) Complement (A'): Everything in U outside circle A.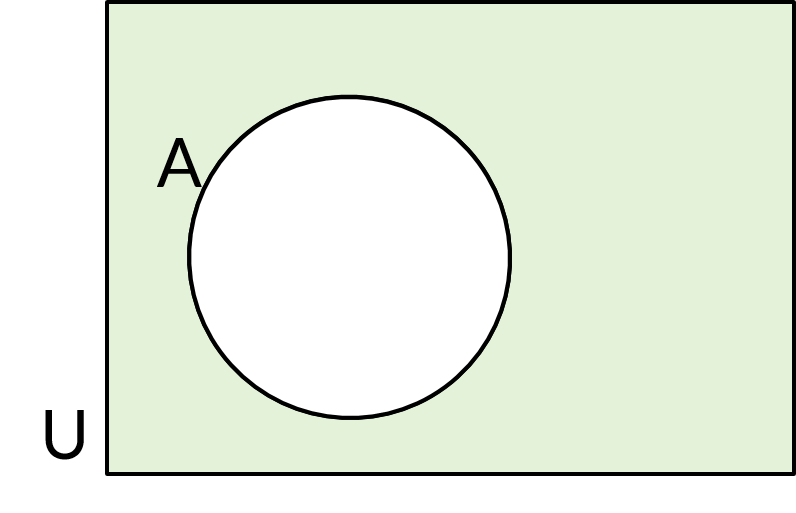
3. Examples
Example 1 (Basic)
Problem: Consider two sets and . Draw a Venn diagram and find and .
Step-by-Step Solution:
- Draw two overlapping circles representing sets A and B.
- Place the numbers in the appropriate regions:
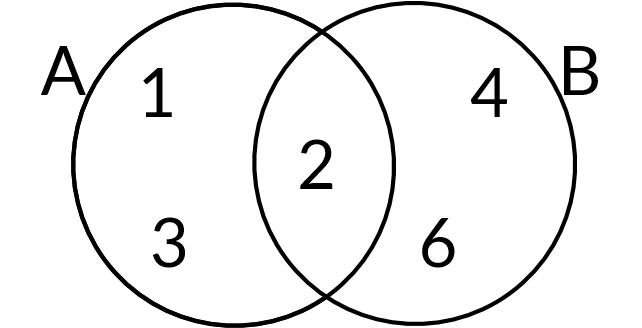
- The union (all elements in A or B).
- The intersection (where A and B overlap).
Example 2 (Intermediate)
Problem: Given four sets: U = {1, 2, 3, 4, 5, 6, 7, 8, 9}, A = { }, B = {1, 3, 5, 7} and C = {3, 6}. Draw a Venn diagram and find , , and the complement of A (A').
Step-by-Step Solution:
- Identify the elements of set A:
Set A consists of natural numbers that are even and less than 10. Here are the elements: 2, 4, 6, 8. - Draw the Universal Set (U) as a rectangle and label circles:
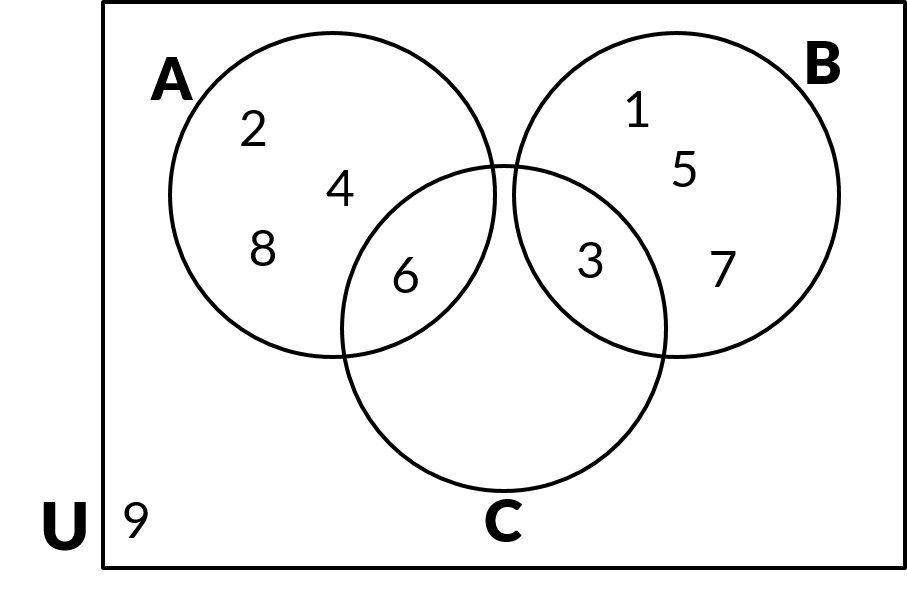
- Identify Regions:
= {6} (where A and C overlap).
= {1, 3, 5, 6, 7} (all elements in B or C).
A' = {1, 3, 5, 7, 9} (elements in U but outside A).
4. Problem-Solving Techniques
- Label Clearly: Write elements in the correct regions.
- Shade for Operations: Union ( ): Shade all involved circles. Intersection ( ): Shade only overlapping areas. Complement: Shade everything outside the set.